Heyy you
By Zane Dax in R
December 11, 2021
Blog Post
This is a blog post about Star Wars.
You can see how many characters have green eyes or your eye color.
starwars %>%
  select(eye_color, height) %>%
  group_by(eye_color) %>%
  ggplot(
    aes(x= height,
        y= eye_color)
  )+
  geom_point(size=3, alpha=0.4, color='black')+
  labs(title = 'Star Wars Data, eye color and height',
       y='eye color')+
  theme(
    text = element_text(size = 12, family = 'Lato'),
    axis.text.y = element_text(size = 12, face = 'bold')
  )
Cars Data
summary(cars)
##      speed           dist
##  Min.   : 4.0   Min.   :  2.00
##  1st Qu.:12.0   1st Qu.: 26.00
##  Median :15.0   Median : 36.00
##  Mean   :15.4   Mean   : 42.98
##  3rd Qu.:19.0   3rd Qu.: 56.00
##  Max.   :25.0   Max.   :120.00
fit <- lm(dist ~ speed, data = cars)
fit
##
## Call:
## lm(formula = dist ~ speed, data = cars)
##
## Coefficients:
## (Intercept)        speed
##     -17.579        3.932
Including Plots
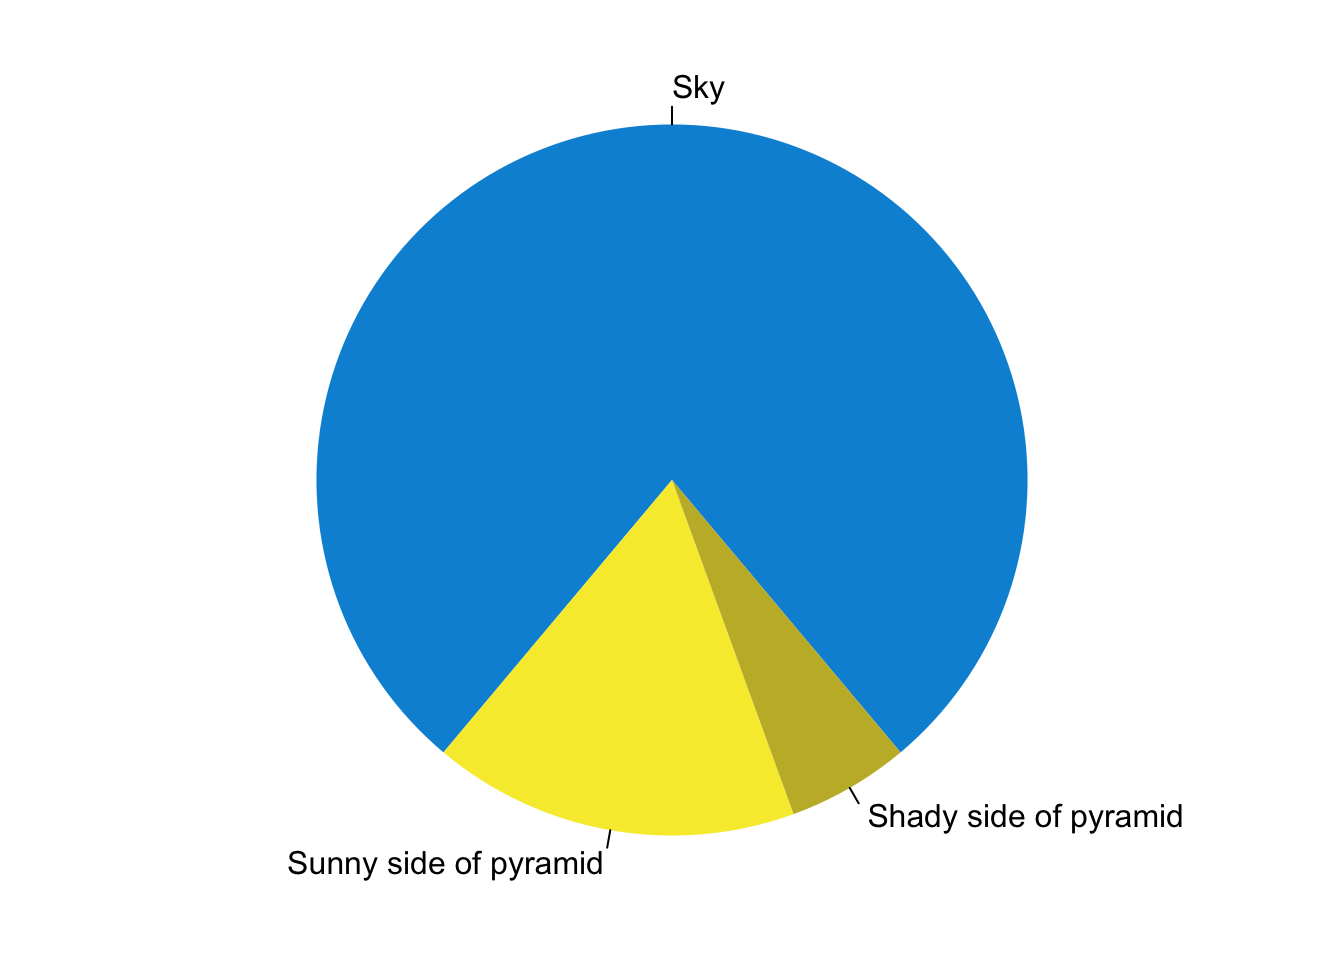
You can also embed plots. See Figure 1 for example:
par(mar = c(0, 1, 0, 1))
pie(
  c(280, 60, 20),
  c('Sky', 'Sunny side of pyramid', 'Shady side of pyramid'),
  col = c('#0292D8', '#F7EA39', '#C4B632'),
  init.angle = -50, border = NA
)
Figure 1: A fancy pie chart.
this concludes the pie section!
- Posted on:
- December 11, 2021
- Length:
- 1 minute read, 194 words
- Categories:
- R
- Tags:
- R Markdown plot regression
- See Also: